Now you will see some numbers pop towards the up direction (average sale price and average sale price per square foot), but overall I still tend to think that July was a poor performing month. The biggest surprise that I noticed was that foreclosure sales were down as compared to the previous month (but I will include the foreclosure data at the end of this report).
Oh yeah... disclosure time...
Disclaimer... all data compiled for this report comes from the WARDEX Data Exchange and does not include any sales activity from outside that resource. All research is done only on single family homes and there is no inclusion of modular homes, commercial properties, or vacant land. The geographical area researched includes; all areas within the boundaries of the city of Kingman, north Kingman, the Hualapai Mountain area, and the Valle Vista subdivisions. Click here to see maps of the included area's.
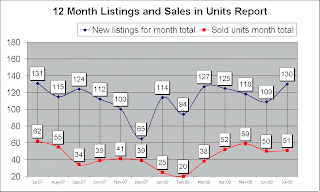
Listings and sales in units chart:
 New listings out pace sales in July by over two and a half times. Not so good.
Average listings and sales averages chart:
 In July, we saw three sales that closed with prices over $400,000 (there were none in June) so I'm sure that is where the spike in average price occurred.
2005 through 2008 unit sales chart:
 The last three months of July are a bit bunched, perhaps making this level 'normal'. Still... we are off from last years pace and if this is the hot selling season then this year will no doubt finish below last year in terms of production. If it wasn't for the high inventory of available listings it would be easier to accept the new level of 'normal' production.
2005 through 2008 average price chart:
 The limited amount of sales in July allowed for a few higher priced sales to affect the average price higher than it might likely be. The monthly figures for average sales has been very inconsistent this year and last year as compared to 2005 and 2006.
2005 through 2008 median price chart:
 Median price for July 2008 fell 11.05% as compared to the previous July.
The price range for units sold in July was from $71,675 through $490,000.
Average SFR statistics:
The average home sold in July had 3.14 bedrooms, 2.2 bathrooms, a 2.16 car garage, included 1,665 square feet of living space, and was built in 1997. The average hold sold for an average of $115 per square foot of living space.
It took an average of 129 days of marketing to attract a buyer to come to an agreement and a total of 165 days from the first day of marketing to the close of escrow.
Sellers reduced price $14,152 to attract a buyer on average from the first day of marketing, and conceded another $12,160 to the buyer in the transaction. The total average price concession for the homes sold in July was $26,312 (12.1% total reduction).
Bonus Charts:

The average price per square foot fell 11.5% as compared to the year before.

Foreclosure Impact:
In terms of units sold, of the 51 sales reported for July -- 10 were listed as foreclosed on (19.6% of units sold).
The price range of foreclosed units sold for July was from $102,000 up to $165,000.
The average price of foreclosed units sold for July was $122,890 (35.7% lower than the overall July figure).
The median price of foreclosed units sold for July was $115,000.
The average foreclosure home sold in July had 3.1 bedrooms, 2 bathrooms, a 1.9 car garage, included 1,499 square feet of living space, and was built in 2000. The average hold sold for an average of $82 per square foot of living space. Owners of foreclosed on homes conceded 15.1% off the initial offering price.
No comments:
Post a Comment