After 5 months of sales in units in the 50's (or better) each month... we have managed to slip off the ledge and are back in the 30's. The traditional selling season is over... WITH A VENGEANCE.
This report won't be pretty and once again it will basically be slanted towards the sellers in this mess. But first... the disclaimer...
Disclaimer... all data compiled for this report comes from the WARDEX Data Exchange and does not include any sales activity from outside that resource. All research is done only on single family homes and there is no inclusion of modular homes, commercial properties, or vacant land. The geographical area researched includes; all areas within the boundaries of the city of Kingman, north Kingman, the Hualapai Mountain area, and the Valle Vista subdivisions. Click here to see maps of the included area's.
Listings and sales in units chart:
 Welcome back my friends to the show that never ends... More listings and less sales in units. It was just a weak, weak selling season. Hate to sound like a Chicago Cubs fan here but ... there is always next year.
Average listings and sales averages chart:
 Here we see for the first time the average asking price be lower for the new listings than the average price paid for homes that closed in September. This almost happened a year ago. It will be interesting to see if these numbers remain close over the next few months. It may mean that the new sellers on the market are getting a better look at the big picture in the market. However, the price per square foot for the asking price of new listings is still about $10 more than the sold average price per square foot. Again... interesting to see how this goes.
2004 through 2007 unit sales chart:
 Sellers... this is part of the big picture. It ain't pretty.
2004 through 2007 average price chart:

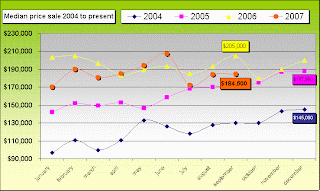
2004 through 2007 median price chart:

Average SFR statistics:
The average home sold in September had 3.29 bedrooms, 2 bathrooms, a 2.176 car garage, included 1,745 square feet of living space, and was built in 1995. The average hold sold for an average of $128 per square foot of living space.
It took an average of 108 days of marketing to attract a buyer to come to an agreement and a total of 148 days from the first day of marketing to the close of escrow.
Sellers reduced price $8,160 to attract a buyer on average from the first day of marketing, and conceded another $10,284 to the buyer in the transaction. The total average price concession for the homes sold in September was $18,444.
Bonus Chart:

Here you can see the sales price slipping in real time. Back in June we saw basically the same size home sell for an average of $5 dollars more per square foot than we just saw last month.
Homes are still selling in Kingman, and any seller can sell their home. The key is price at this time. Remember to price your home 'in' the market and not simply 'on' the market.
Till next time...
No comments:
Post a Comment