Interesting data for April... the average price swings back up, sales in units is up again over last year (albeit beating last years figure by one unit), and total price concession was also up over the $30,000 mark. Mixed bag of results overall.
Let's get started... first the disclaimer...
Disclaimer... all data compiled for this report comes from the WARDEX Data Exchange and does not include any sales activity from outside that resource. All research is done only on single family homes and there is no inclusion of modular homes, commercial properties, or vacant land. The geographical area researched includes; all areas within the boundaries of the city of Kingman, north Kingman, the Hualapai Mountain area, and the Valle Vista subdivisions. Click here to see maps of the included area's.
Listings and sales in units chart:
 The market is basically performing the same as it did last year... which really wasn't that good, but if we want to put a positive spin on it -- at least the performance did not get worse. New listing units were down 4.6% and unit sales are up over last year at this time by 1.9%. Still too much gap between hopeful sellers and actual buyers.
Average listings and sales averages chart:

As you can see the average sales price bounced back up after actually finishing lower than at any point in the last year. Does this mean the theoretical 'bottom' of the market is near?? Let's wait a couple of more months before drawing that conclusion. This could be an anomaly as we saw multiple units close transactions in April with a final sale price of over $500,000, where as there were only two units (total) that sold for over that amount since October of last year through March of this year.
2005 through 2008 unit sales chart:
 I think the only comment that works here is to wonder if prices have fallen enough to maintain at least 2007 production numbers. 2007 was a bad year, but beating a bad year would be a good thing. With summer months getting close it would be nice to see the market eclipse at least one month from 2006. There has been an increased level of new pending listings for a few months now so it could happen by June or July.
BTW, it took about an average of 6 months for the 52 sales reported on for April to happen. Many units were on the market for nearly a full year and one half.
2005 through 2008 average price chart:
 Been a few months since we've seen the average price in line with the previous years mark. My hunch is the average sales figure yo-yo's around in between current levels and 2005 levels... just a hunch though.
The average sales price for April of 08 was down only 1.9% as compared to the April of 07.
2005 through 2008 median price chart:
 The median price for April 2008 was off 8.2% as compared to the April 2007 figure, but it bounced back up over 2005 levels.
The price range of units sold for April was between $68,100 through $570,000.
Average SFR statistics:
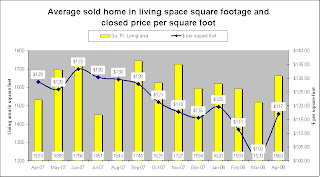
The average home sold in April had 3.25 bedrooms, 2 bathrooms, a 2.25 car garage, included 1,663 square feet of living space, and was built in 1997. The average hold sold for an average of $117 per square foot of living space.
It took an average of 136 days of marketing to attract a buyer to come to an agreement and a total of 177 days from the first day of marketing to the close of escrow.
Sellers reduced price $19,033 to attract a buyer on average from the first day of marketing, and conceded another $11,083 to the buyer in the transaction. The total average price concession for the homes sold in April was $30,116.
Bonus Charts:
 The average price per square foot fell 9.3% as compared to the year before.
 Sellers in April conceded 13.39% off of their original listing price from when the property entered the market until it successfully closed. That is just over 5 points more than sellers conceded at this time last year.
As I said at the beginning... interesting stats for April. I think I'll head out and do some fishing today so I'll see you next time.
No comments:
Post a Comment