For an example here is a quick 'good news' vs. 'bad news'. Last month we saw more single family home units sell than in the previous year for August... good news. However, of the 59 units that sold last month, 30 were listed as foreclosed... more sales were made by banks than by human sellers.
Let's look at all the data... but first... the disclaimer...
Disclaimer... all data compiled for this report comes from the WARDEX Data Exchange and does not include any sales activity from outside that resource. All research is done only on single family homes and there is no inclusion of modular homes, commercial properties, or vacant land. The geographical area researched includes; all areas within the boundaries of the city of Kingman, north Kingman, the Hualapai Mountain area, and the Valle Vista subdivisions. Click here to see maps of the included area's.
Listings and sales in units chart:
 Good to see that more units sold in August of 2008 than in August of 2007, even if it is only by a few units. Of course this result has been fueled by the foreclosures that are on the market. Foreclosures normally are listed for lower prices making more homes affordable for the local Kingman resident. However, still we are not seeing enough unit sales as compared to the new listings hitting the market to put any pressure on the buyer.
Average listings and sales averages chart:
 And there is the dramatic fall in the average sales price, but this should be expected when over half of the sales last month were of the foreclosed variety. Times... well... they are 'a changin'.
2005 through 2008 unit sales chart:
 I'm getting the feeling that the production that we've seen now for the last few years will be normal and the production we saw in 2005 is the exception. A level we may not see again in the Kingman area.
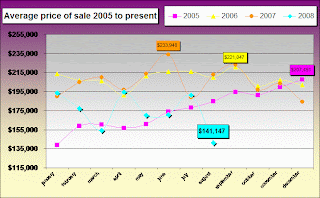
2005 through 2008 average price chart:
 Last months average sales figure looks a bit lonely.
2005 through 2008 median price chart:
 Median price for August 2008 fell 28.4% compared to the median for the previous August.
The price range for units sold in August was from $38,900 through $330,000.
Average SFR statistics:
The average home sold in August had 2.97 bedrooms, 2 bathrooms, a 1.9 car garage, included 1,488 square feet of living space, and was built in 1995. The average hold sold for an average of $95 per square foot of living space.
It took an average of 102 days of marketing to attract a buyer to come to an agreement and a total of 145 days from the first day of marketing to the close of escrow.
Sellers reduced price $16,707 to attract a buyer on average from the first day of marketing, and conceded another $7,882 to the buyer in the transaction. The total average price concession for the homes sold in August was $24,584 (14.83% total reduction).
Bonus Charts:
 The average price per square foot has fallen 26.9% since August of last year.
 Foreclosure Impact:
In terms of units sold, of the 59 sales reported for August -- 30 were listed as foreclosed on (50.8% of units sold).
The price range of foreclosed units sold for August was from $38,900 up to $218,888.
The average price of foreclosed units sold for August was $122,937 (12.9% lower than the overall August figure).
The median price of foreclosed units sold for August was $120,000.
The average foreclosure home sold in August had 3 bedrooms, 2 bathrooms, a 1.67 car garage, included 1,453 square feet of living space, and was built in 1994. The average hold sold for an average of $85 per square foot of living space. Owners of foreclosed on homes conceded 13.8% off the initial offering price.
No comments:
Post a Comment