You gotta like that... I jumped straight in with the bad news. No sugar coating here. No 'Realtor Spin'. Nothing.
Also worth noting... June of 2007 saw the highest average sale figure for any month since I began to track this data. As you will see on the charts... we are slipping off the charts very quickly.
As a bonus this month I will report on the foreclosure impact on sales. Look for it somewhere after the disclaimer...
Disclaimer... all data compiled for this report comes from the WARDEX Data Exchange and does not include any sales activity from outside that resource. All research is done only on single family homes and there is no inclusion of modular homes, commercial properties, or vacant land. The geographical area researched includes; all areas within the boundaries of the city of Kingman, north Kingman, the Hualapai Mountain area, and the Valle Vista subdivisions. Click here to see maps of the included area's.
Listings and sales in units chart:
 Production slipped compared to the previous two months this year, but is no worse than it was last year. Listings are trending down at a slightly steeper angle than sales figures but not enough to bring these lines together anytime soon. Really... more of the same as it has been for some time now.
Average listings and sales averages chart:

Both lines are trending dramatically lower over the last year, however (and this is bad news in my opinion) average sales figures are actually trending at a lower rate than are new listings. This clearly tells me that sellers are simply not being aggressive enough with their price offering and buyers are still waiting for the right priced property to make an offer on.
Sellers really need to consider their offering price for 90 days down the road, instead of 90 days ago.
2005 through 2008 unit sales chart:

With the exception of the first two months this year, the production numbers are swimming along nicely... WITH THE WORST YEAR IN TERMS OF PRODUCTION (since I've been keeping track). Nothing to get all that excited about really. In some ways I'm beginning to feel that the production numbers from all of last year and up to this point are 'normal'. I know that 2005 was NOT normal and it is silly to compare this years production to 2005.
2005 through 2008 average price chart:

Here we will compare the average sales price for June of 2008 against June of 2005, and it is clear that once again the average sales price is below the 2005 level. I have a hunch that the light blue line representing 2008 will look a bit lonely as the next six months start to go by.
If we compare the average price in June of 2007 to June of this year you will see that the figure has fallen 27%. While there was no change to the production numbers year over year, the average price took a huge beating.
What do you think?? Will it correct more or are we bottoming out??
2005 through 2008 median price chart:

The median price fell 27.2% as compared to June of 2007.
The price range of units sold for June of 2008 was from $30,000 to $377,400
Average SFR statistics:
The average home sold in June had 3.04 bedrooms, 2 bathrooms, a 2.06 car garage, included 1,632 square feet of living space, and was built in 1996. The average hold sold for an average of $105 per square foot of living space.
It took an average of 109 days of marketing to attract a buyer to come to an agreement and a total of 143 days from the first day of marketing to the close of escrow.
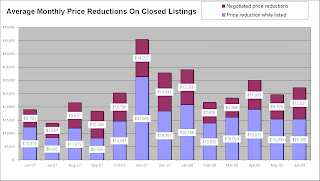
Sellers reduced price $15,359 to attract a buyer on average from the first day of marketing, and conceded another $12,021 to the buyer in the transaction. The total average price concession for the homes sold in May was $27,380 (13.82% total reduction).
Bonus Charts:

The average price per square foot fell 21.5% as compared to the year before.

Foreclosure Impact:
I just began to track the foreclosure listings and sales a few months ago, so no fancy charts to share... just raw data.
In terms of units sold, of the 50 sales reported for June -- 16 were listed as foreclosed on (32% of units sold).
The price range of foreclosed units sold for June was from $30,000 up to $325,000.
The average price of foreclosed units sold for June was $149,425 (12.5% lower than the overall June figure).
The median price of foreclosed units sold for June was $129,000.
The average foreclosure home sold in June had 3.13 bedrooms, 2 bathrooms, a 1.875 car garage, included 1,573 square feet of living space, and was built in 1996. The average hold sold for an average of $95 per square foot of living space. Owners of foreclosed on homes conceded 13.2% off the initial offering price.
I hope this foreclosure data was helpful. If you like it I will continue to offer it with the normal stuff for at least as long as the foreclosures are having the kind of impact on the market that they seem to be having right now.
One half of the year down... one half to go. The race is on to see if 2008 can eclipse the lame production figures of 2007. See you next time.
No comments:
Post a Comment