Friday, October 23, 2009


Thursday, October 22, 2009
September Sales Report (2009)
Like a Jimmy Rollins gap shot down one run with two aboard and two outs in the bottom of the ninth inning versus... say the Dodgers in game four of the NLCS, the sales activity for the previous month was incredible.
Yes folks, this means I'm watching a bit of baseball these days (the HD tv in my living room has me mesmerized and coupled with the busy days has left me little time to blog). While I'm having fun getting ready for the next opponent for my beloved Phillies I thought I'd pass along the following market report.
I think some of the data will surprise you. The last time my reports showed this much activity in a month I was writing blog posts like this one.
So enjoy this one and I hope to catch up with some other posts about the local happenings over the weekend. Cheers folks...
Disclaimer... all data compiled for this report comes from the WARDEX Data Exchange and does not include any sales activity from outside that resource. All research is done only on single family homes and there is no inclusion of modular homes, commercial properties, or vacant land. The geographical area researched includes; all areas within the boundaries of the city of Kingman, north Kingman, the Hualapai Mountain area, and the Valle Vista subdivisions. Click here to see maps of the included area's.
Listings and sales in units chart:
 Oh my... the last time 82 units were sold in a month it was May of 2006... seems like oh so very long ago.
Average listings and sales averages chart:
 The song remains the same for prices, no need to delve further.
2006 through 2009 unit sales chart:
 Also noteworthy... sales in units in 2009 have already eclipsed the total number of all sales in 2008... with one quarter to go.
Sales in September of 2009 were up 90% compared to the previous year.
2006 through 2009 average price chart:
 Prices are meandering a bit, a nice bump for traditional sellers last month though. My hats off to you.
The average price slipped 17% as compared to the September of 2008 average sales price.
2006 through 2009 median price chart:
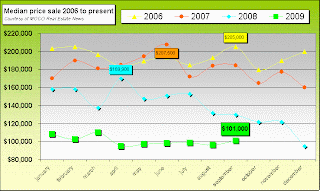
The median price fell 22% compared to September of last year.
Final sales prices in September 2009 ranged from $18,000 to $292,000.
Average SFR statistics:
Bonus Charts:


Wrap Up:
As stated earlier... a good month for sellers (and isn't about time!!). Of course keep in mind the splits between traditional sellers and foreclosures... banks still are dominating the sales market at this time.
I was hoping to see an month like September finally after the last few very good months of activity shown in the listing and pending reports.
Not one for making bold predictions or anything so I'll just do like I do as I'm watching my beloved Phillies move on in the playoffs... I just feel at peace and have confidence that things will work themselves out. Plus it doesn't hurt when your team is defending World Champions and look better than they did the previous year. To me Kingman will always be the defending World Champion. Better days ahead.
Yes folks, this means I'm watching a bit of baseball these days (the HD tv in my living room has me mesmerized and coupled with the busy days has left me little time to blog). While I'm having fun getting ready for the next opponent for my beloved Phillies I thought I'd pass along the following market report.
I think some of the data will surprise you. The last time my reports showed this much activity in a month I was writing blog posts like this one.
So enjoy this one and I hope to catch up with some other posts about the local happenings over the weekend. Cheers folks...
Disclaimer... all data compiled for this report comes from the WARDEX Data Exchange and does not include any sales activity from outside that resource. All research is done only on single family homes and there is no inclusion of modular homes, commercial properties, or vacant land. The geographical area researched includes; all areas within the boundaries of the city of Kingman, north Kingman, the Hualapai Mountain area, and the Valle Vista subdivisions. Click here to see maps of the included area's.
Listings and sales in units chart:
 Oh my... the last time 82 units were sold in a month it was May of 2006... seems like oh so very long ago.
Average listings and sales averages chart:
 The song remains the same for prices, no need to delve further.
2006 through 2009 unit sales chart:
 Also noteworthy... sales in units in 2009 have already eclipsed the total number of all sales in 2008... with one quarter to go.
Sales in September of 2009 were up 90% compared to the previous year.
2006 through 2009 average price chart:
 Prices are meandering a bit, a nice bump for traditional sellers last month though. My hats off to you.
The average price slipped 17% as compared to the September of 2008 average sales price.
2006 through 2009 median price chart:

The median price fell 22% compared to September of last year.
Final sales prices in September 2009 ranged from $18,000 to $292,000.
Average SFR statistics:
Data tables for all sales tracked in September 2009
| Item | Sep. '09 |
|---|---|
| Average Price per Unit Sold | $121,642 |
| Median Price per Unit Sold | $101,000 |
| Average Price per Square Foot | $76 |
| Item | Sep. '09 |
|---|---|
| Ave Living Space per Square Foot | 1,600 |
| Bedrooms | 3.13 |
| Bathrooms | 2.11 |
| Garage | 1.9 |
| Year Built | 1996 |
| Item | Sep. '09 |
|---|---|
| Days on Market to Contract | 84 |
| Days on Market to Close | 129 |
| Price Reductions on Market | $10,805 |
| Negotiated Price Concessions | $5,871 |
| Total Price Concessions | $16,676 |
| Total Percent Conceded | 12.06% |
Bonus Charts:


Traditional Seller vs. Bank Owned sales comparison for September 2009
| Item | Traditional Seller | Bank Owned |
|---|---|---|
| Total Units Sold in Month | 34 | 48 |
| Average Price per Unit Sold | $157,336 | $96,358 |
| Median Price per Unit Sold | $125,000 | $88,500 |
| Average Price per Square Foot | $93 | $63 |
| Item | Traditional Seller | Bank Owned |
|---|---|---|
| Ave Living Space per Square Foot | 1,698 | 1,531 |
| Bedrooms | 3.2 | 3.0 |
| Bathrooms | 2.15 | 2.1 |
| Garage | 2.2 | 1.7 |
| Year Built | 1995 | 1996 |
| Item | Traditional Seller | Bank Owned |
|---|---|---|
| Days on Market to Contract | 127 | 53 |
| Days on Market to Close | 174 | 96 |
| Price Reductions on Market | $13,676 | $8,771 |
| Negotiated Price Concessions | $10,879 | $2,325 |
| Total Price Concessions | $24,555 | $11,096 |
| Total Percent Conceded | 13.5% | 10.3% |
Wrap Up:
As stated earlier... a good month for sellers (and isn't about time!!). Of course keep in mind the splits between traditional sellers and foreclosures... banks still are dominating the sales market at this time.
I was hoping to see an month like September finally after the last few very good months of activity shown in the listing and pending reports.
Not one for making bold predictions or anything so I'll just do like I do as I'm watching my beloved Phillies move on in the playoffs... I just feel at peace and have confidence that things will work themselves out. Plus it doesn't hurt when your team is defending World Champions and look better than they did the previous year. To me Kingman will always be the defending World Champion. Better days ahead.
Friday, October 02, 2009
Thursday, October 01, 2009
September Listings Report (2009)
The good news is that the Philadelphia Phillies clinched their division last night, meaning they get to go on to the playoffs for the third straight season. Means also that my fan related blood pressure will rise for as long as they remain in the playoffs for this next month... the month of October. Really?? Already?? The time sure is flying.
Not sure if there really is any bad news in this listings report. Much of it is the same old same old as we have been accustomed to here in the Kingman area. Let's get right to it, after the disclaimer of course...
Disclaimer... all data compiled for this report comes from the WARDEX Data Exchange and does not include any sales activity from outside that resource. All research is done only on single family homes and there is no inclusion of modular homes, commercial properties, or vacant land. The geographical area researched includes; all areas within the boundaries of the city of Kingman, north Kingman, the Hualapai Mountain area, and the Valle Vista subdivisions. Click here to see maps of the included area's.
The prime selling summer months are over and the numbers reflect that as the total number of new listings in the month of September is down back in the double digits again (where it really needs to be until there is more of something that looks like a balanced market). The average price is up on these new listings, which is not reflective of the market, but probably did so because there were a few high dollar listings that were put on the market in September.
All in all, much of what I expected to see for the month of September.
More of the same here for new contracts as it was for new listings above. The prime selling summer months have zipped by. Foreclosures remain the most sought after type of housing even with the sagging numbers. Banks didn't see the same sort of drop off in activity as traditional sellers did last month.
Again, typical and what could be expected for this time of year based on the data over the previous years.
So let's take a look at year over year data now...
Year over year data listings/pending contracts
Inventory is down and activity is up compared to last year... it is the best thing that can be said looking at the tables. However, inventory is still too high in all reality which most likely means that there will be more pressure on sellers to reduce price further as the market slides into the slower months of the year.
I have a bad feeling that it will feel as if we all took one step forward, but we will have to take a step and a half or two steps back.
Cheers folks.
Not sure if there really is any bad news in this listings report. Much of it is the same old same old as we have been accustomed to here in the Kingman area. Let's get right to it, after the disclaimer of course...
Disclaimer... all data compiled for this report comes from the WARDEX Data Exchange and does not include any sales activity from outside that resource. All research is done only on single family homes and there is no inclusion of modular homes, commercial properties, or vacant land. The geographical area researched includes; all areas within the boundaries of the city of Kingman, north Kingman, the Hualapai Mountain area, and the Valle Vista subdivisions. Click here to see maps of the included area's.
Data tables for all new listings tracked in the month of September 2009
| Item | Total Units | Previous Month |
|---|---|---|
| Total Listings On Market | 430 | 426 |
| Total Listings Listed as Foreclosed | 63 | 62 |
| Item | Month of September | Previous Month |
|---|---|---|
| New Listings Total | 88 | 105 |
| New Listings Listed as Foreclosed | 32 | 43 |
| Average Asking Price Per Unit | $158,623 | $133,546 |
| Median Asking Price | $119,000 | $109,950 |
| Average Asking Price Per Square Foot | $96 | $84 |
| Units Re-Listed | 9 | 11 |
| Units Already Under Contract | 14 | 28 |
| Item | Month of September | Previous Month |
|---|---|---|
| Living Area Square Footage | 1,644 | 1,582 |
| Bedrooms | 3.16 | 2.97 |
| Bathrooms | 2.13 | 2.06 |
| Garage | 2.0 | 1.89 |
| Year Built | 1993 | 1991 |
| Item | Lowest | Highest |
| Listings | $29,680 | $799,900 |
The prime selling summer months are over and the numbers reflect that as the total number of new listings in the month of September is down back in the double digits again (where it really needs to be until there is more of something that looks like a balanced market). The average price is up on these new listings, which is not reflective of the market, but probably did so because there were a few high dollar listings that were put on the market in September.
All in all, much of what I expected to see for the month of September.
Data tables for all new Units under contract tracked in the month of September 2009
| Item | Total Units | Previous Month |
|---|---|---|
| Total Units Under Contract | 127 | 162 |
| Total Contracts Listed as Foreclosed | 61 | 76 |
| Item | Month of September | Previous Month |
|---|---|---|
| New Contracts Total | 62 | 84 |
| New Contracts Listed as Foreclosed | 36 | 44 |
| Average Marketing Price Per Unit | $133,579 | $118,501 |
| Median Marketing Price | $110,000 | $101,998 |
| Average Marketing Price Per Square Foot | $81 | $77 |
| Days on Market to Acquire a Contract | 92 | 94 |
| Average Marketing Price Reduction | $14,793 | $12,828 |
| Item | Month of September | Previous Month |
|---|---|---|
| Living Area Square Footage | 1,642 | 1,545 |
| Bedrooms | 3.13 | 3.02 |
| Bathrooms | 2.11 | 2.03 |
| Garage | 2.0 | 1.87 |
| Year Built | 1995 | 1993 |
| Item | Lowest | Highest |
| Listings | $24,900 | $640,000 |
More of the same here for new contracts as it was for new listings above. The prime selling summer months have zipped by. Foreclosures remain the most sought after type of housing even with the sagging numbers. Banks didn't see the same sort of drop off in activity as traditional sellers did last month.
Again, typical and what could be expected for this time of year based on the data over the previous years.
So let's take a look at year over year data now...
Year over year data listings/pending contracts
| Item | UP/DOWN | unit/dollar amount | Percentage |
|---|---|---|---|
| Total Listings | DOWN | 201 | (32%) |
| New Listings September | DOWN | 1 | (1%) |
| Average Price per New Listing | DOWN | $34,737 | (18%) |
| Median List Price | DOWN | $30,450 | (20%) |
| Item | UP/DOWN | unit/dollar amount | Percentage |
|---|---|---|---|
| Total Pending Contracts | UP | 53 | 71% |
| New Contracts for September | UP | 8 | 15% |
| Average Marketing Price per Unit | DOWN | $18,349 | (12%) |
| Median Marketing Price | DOWN | $15,000 | (12%) |
Inventory is down and activity is up compared to last year... it is the best thing that can be said looking at the tables. However, inventory is still too high in all reality which most likely means that there will be more pressure on sellers to reduce price further as the market slides into the slower months of the year.
I have a bad feeling that it will feel as if we all took one step forward, but we will have to take a step and a half or two steps back.
Cheers folks.
Wednesday, September 16, 2009
August Sales Report (2009)
Well here is to the first sales report from New Mexico. Truth be told, I've done some of these reports from other parts of the country before so nothing brand new here. However my main challenge this time is I'm still setting up my computers here in NM and I've not established a new 'routine' if you will. This is why this report comes out today about a week later than normal.
And unfortunately the data in this report is not as hoped. For the first time this year the total number of sales in units in the month is lower than it was in the previous year. There was good news in the listing report earlier this month that showed plenty of activity, meaning a good number of homes going into contract -- but for whatever reason that activity has not equaled success in the number of sales. Let's see the numbers... after the disclaimer of course...
Disclaimer... all data compiled for this report comes from the WARDEX Data Exchange and does not include any sales activity from outside that resource. All research is done only on single family homes and there is no inclusion of modular homes, commercial properties, or vacant land. The geographical area researched includes; all areas within the boundaries of the city of Kingman, north Kingman, the Hualapai Mountain area, and the Valle Vista subdivisions. Click here to see maps of the included area's.
Listings and sales in units chart:
 As you can see the numbers on the red line in the graph indicate that the total number of sales topped out in June of this year. I was surprised to see the number fall to 53 for the month of August, normally a strong month for sales. Last year August proved to be the best month for sales, well at least tied for the best month, with 59. So we are off a bit.
Average listings and sales averages chart:
 The average sale price seems to have leveled off as I thought it might in a report from a few months ago. More on this later on. For traditional sellers and those thinking about selling please take a good look at the success rate as indicated by the red line in the graph above. If you can market your home at that level, you will have the best chance to move your property quickly.
2006 through 2009 unit sales chart:
 In my opinion the softening of production indicates that buyers are a bit more scarce than hoped for, even after the huge decreases in prices over the last year. Where we go from here may not be pretty. Hope I'm very wrong about that though.
Sales in August of 2009 were off about 12% compared to the previous year.
2006 through 2009 average price chart:
 The green line in the graph above clearly shows that prices have stabilized quite a bit this year. However, these new lower prices have not brought out as many buyers as hoped for in the Kingman area. I get a bad feeling that we will see another round of falling prices to lure additional buyers to the market. And it will likely be the foreclosures that will move the market price downward yet again.
The average price slipped 22% as compared to the August of 2008 average sales price.
2006 through 2009 median price chart:

The median price fell 27% compared to July of last year.
Final sales prices in August 2009 ranged from $15,000 to $312,000.
Average SFR statistics:
Bonus Charts:


Foreclosure Impact:
Another month where we saw the foreclosure listings dominate the sales market. Really take a good look at the side by side comparisons. Scary stuff... for traditional sellers. Actually pretty scary for real estate professionals as well. The marketing time alone before the average traditional seller agrees to a contract... a little over four additional months of waiting for just the right buyer to come along.
Wrap Up:
Not much else to add this month as once again the number do tell the story just fine on their own.
I could go on a local political rant about creating demand for the Kingman community, as quite simply there is hardly any demand for property in Kingman at the moment... just like there is hardly any demand for employers to hire employees and all that... but I'll leave that alone at this time.
I still think that the community has so much going for it that could lead to additional demand, Kingman is simply a wonderful place to be. So here is to better days ahead!! See you next month (hopefully I'll find a goodly routine so I get this report out sooner than I did this month).
And unfortunately the data in this report is not as hoped. For the first time this year the total number of sales in units in the month is lower than it was in the previous year. There was good news in the listing report earlier this month that showed plenty of activity, meaning a good number of homes going into contract -- but for whatever reason that activity has not equaled success in the number of sales. Let's see the numbers... after the disclaimer of course...
Disclaimer... all data compiled for this report comes from the WARDEX Data Exchange and does not include any sales activity from outside that resource. All research is done only on single family homes and there is no inclusion of modular homes, commercial properties, or vacant land. The geographical area researched includes; all areas within the boundaries of the city of Kingman, north Kingman, the Hualapai Mountain area, and the Valle Vista subdivisions. Click here to see maps of the included area's.
Listings and sales in units chart:
 As you can see the numbers on the red line in the graph indicate that the total number of sales topped out in June of this year. I was surprised to see the number fall to 53 for the month of August, normally a strong month for sales. Last year August proved to be the best month for sales, well at least tied for the best month, with 59. So we are off a bit.
Average listings and sales averages chart:
 The average sale price seems to have leveled off as I thought it might in a report from a few months ago. More on this later on. For traditional sellers and those thinking about selling please take a good look at the success rate as indicated by the red line in the graph above. If you can market your home at that level, you will have the best chance to move your property quickly.
2006 through 2009 unit sales chart:
 In my opinion the softening of production indicates that buyers are a bit more scarce than hoped for, even after the huge decreases in prices over the last year. Where we go from here may not be pretty. Hope I'm very wrong about that though.
Sales in August of 2009 were off about 12% compared to the previous year.
2006 through 2009 average price chart:
 The green line in the graph above clearly shows that prices have stabilized quite a bit this year. However, these new lower prices have not brought out as many buyers as hoped for in the Kingman area. I get a bad feeling that we will see another round of falling prices to lure additional buyers to the market. And it will likely be the foreclosures that will move the market price downward yet again.
The average price slipped 22% as compared to the August of 2008 average sales price.
2006 through 2009 median price chart:

The median price fell 27% compared to July of last year.
Final sales prices in August 2009 ranged from $15,000 to $312,000.
Average SFR statistics:
Data tables for all sales tracked in August 2009
| Item | Aug. '09 |
|---|---|
| Average Price per Unit Sold | $110,069 |
| Median Price per Unit Sold | $96,203 |
| Average Price per Square Foot | $69 |
| Item | Aug. '09 |
|---|---|
| Ave Living Space per Square Foot | 1,585 |
| Bedrooms | 2.94 |
| Bathrooms | 2.09 |
| Garage | 1.77 |
| Year Built | 1990 |
| Item | Aug. '09 |
|---|---|
| Days on Market to Contract | 107 |
| Days on Market to Close | 142 |
| Price Reductions on Market | $17,340 |
| Negotiated Price Concessions | $6,033 |
| Total Price Concessions | $23,373 |
| Total Percent Conceded | 17.5% |
Bonus Charts:


Foreclosure Impact:
Another month where we saw the foreclosure listings dominate the sales market. Really take a good look at the side by side comparisons. Scary stuff... for traditional sellers. Actually pretty scary for real estate professionals as well. The marketing time alone before the average traditional seller agrees to a contract... a little over four additional months of waiting for just the right buyer to come along.
Traditional Seller vs. Bank Owned sales comparison for August 2009
| Item | Traditional Seller | Bank Owned |
|---|---|---|
| Total Units Sold in Month | 19 | 34 |
| Average Price per Unit Sold | $130,334 | $98,744 |
| Median Price per Unit Sold | $110,000 | $86,900 |
| Average Price per Square Foot | $82 | $62 |
| Item | Traditional Seller | Bank Owned |
|---|---|---|
| Ave Living Space per Square Foot | 1,581 | 1,587 |
| Bedrooms | 2.95 | 2.94 |
| Bathrooms | 2.11 | 2.09 |
| Garage | 2.0 | 1.65 |
| Year Built | 1991 | 1990 |
| Item | Traditional Seller | Bank Owned |
|---|---|---|
| Days on Market to Contract | 195 | 59 |
| Days on Market to Close | 226 | 94 |
| Price Reductions on Market | $27,842 | $11,471 |
| Negotiated Price Concessions | $12,166 | $2,606 |
| Total Price Concessions | $40,008 | $14,077 |
| Total Percent Conceded | 23.5% | 12.5% |
Wrap Up:
Not much else to add this month as once again the number do tell the story just fine on their own.
I could go on a local political rant about creating demand for the Kingman community, as quite simply there is hardly any demand for property in Kingman at the moment... just like there is hardly any demand for employers to hire employees and all that... but I'll leave that alone at this time.
I still think that the community has so much going for it that could lead to additional demand, Kingman is simply a wonderful place to be. So here is to better days ahead!! See you next month (hopefully I'll find a goodly routine so I get this report out sooner than I did this month).
Tuesday, September 15, 2009
Solar plant discussions part deux...
Just a reminder that the Mohave County Planning and Zoning Commission will continue the meetings on the two proposed solar power plants tomorrow September 16th at 10:00am at the county administration building on Beale.
I was not there last week and haven't watched the video of the meeting online or otherwise. Judging from the articles published so far, it sounds like only the Albiassa owned plant made it to the public discussion. I am more interested in the Hualapai Valley Solar project (the one near the Red Lake area) as they are the group talking about using waste water produced by the residents in the Kingman area. I see it as a smarter way to use the 'precious' resource rather than allowing it to simply evaporate away after one use.
So if you are in the area, stop by and check out this meeting. Feel free to give some updates in the comments, share with everyone your take.
As a reminder of what went down at last weeks meeting, my good friend Dave Hawkins sent me the following article that will appear in this weeks Standard. It is posted below all italicized and all that.
Article provided by Dave Hawkins
Consideration of requests related to proposed development of a major solar power facility southeast of Kingman featured plenty of familiar debate between those who support and oppose the project. But discussion at the September 9 meeting of the Mohave County Planning and Zoning Commission also included exchanges between a couple Commission members and Mike Horner, the Litchfield Park resident who owns the land where the 200-megawatt AlbiasaCorp. facility would be built and operated.
Member Mehdi Azarmi said the operation's consumption of groundwater has been the key issue of concern all along and that project officials need to be more specific and factual in that arena. Azarmi and Commissioner Carl Flusche said varying numbers keep surfacing in discussions.
``You gotta (sic) start being up-front and straight shooters with the people because otherwise you're not going to get the results that you want," Flusche said.
Horner responded that groundwater consumption was forecast between 1,000 and 4,000 acre-feet per year when the project was initially announced. He said engineering and design analysis has refined that figure to a current consumption expectation of 2,275 acre-feet per year.
Flusche said Commission members received e-mail and other communication from citizens who complained they didn't get straight answers during the series of public information meetings that project officials held in previous months. Horner said the complaints come from critics who can't reasonably consider the merits of the project.
``The data that was given at some of our meetings was not the data that some of the opponents were looking for and that's probably the reason that they blew up your phones or sent you 15 e-mails," Horner said. ``Anybody who knows me knows I'm probably more direct than courteous. I'm very direct and if I know it I will tell you what it is, and if I don't I'll tell you I don't know, but I'll find out. I don't come to these meetings to try to pull the wool over anybody's eyes."
Project critics, as they have whenever the solar facility has been the subject of a public meeting, spoke critically of use of technology that will consume groundwater. They repeated their concern that the water is consumed locally to generate power that will be sold elsewhere to the highest bidder.
Project officials and their supporters repeated their point that the power plant will serve as a stimulus to the local economy and take a necessary progressive step forward as the nation turns to cleaner energy production and the need to wean itself of its foreign oil dependance. They again noted the 1,000 jobs that would be provided during project construction and the 100-plus people who would be put to work to run the facility.
The discussion gobbled up about two hours, and the Commission adjourned the meeting without voting on Albiassa matters or other requests related to the larger Hualapai Valley Solar facility proposed north of Kingman. Both projects were to come back before the Commission in a continued hearing scheduled September 16.
(Look to future editions of the Standard for continued coverage of the solar power project proposals)
I was not there last week and haven't watched the video of the meeting online or otherwise. Judging from the articles published so far, it sounds like only the Albiassa owned plant made it to the public discussion. I am more interested in the Hualapai Valley Solar project (the one near the Red Lake area) as they are the group talking about using waste water produced by the residents in the Kingman area. I see it as a smarter way to use the 'precious' resource rather than allowing it to simply evaporate away after one use.
So if you are in the area, stop by and check out this meeting. Feel free to give some updates in the comments, share with everyone your take.
As a reminder of what went down at last weeks meeting, my good friend Dave Hawkins sent me the following article that will appear in this weeks Standard. It is posted below all italicized and all that.
Article provided by Dave Hawkins
Consideration of requests related to proposed development of a major solar power facility southeast of Kingman featured plenty of familiar debate between those who support and oppose the project. But discussion at the September 9 meeting of the Mohave County Planning and Zoning Commission also included exchanges between a couple Commission members and Mike Horner, the Litchfield Park resident who owns the land where the 200-megawatt AlbiasaCorp. facility would be built and operated.
Member Mehdi Azarmi said the operation's consumption of groundwater has been the key issue of concern all along and that project officials need to be more specific and factual in that arena. Azarmi and Commissioner Carl Flusche said varying numbers keep surfacing in discussions.
``You gotta (sic) start being up-front and straight shooters with the people because otherwise you're not going to get the results that you want," Flusche said.
Horner responded that groundwater consumption was forecast between 1,000 and 4,000 acre-feet per year when the project was initially announced. He said engineering and design analysis has refined that figure to a current consumption expectation of 2,275 acre-feet per year.
Flusche said Commission members received e-mail and other communication from citizens who complained they didn't get straight answers during the series of public information meetings that project officials held in previous months. Horner said the complaints come from critics who can't reasonably consider the merits of the project.
``The data that was given at some of our meetings was not the data that some of the opponents were looking for and that's probably the reason that they blew up your phones or sent you 15 e-mails," Horner said. ``Anybody who knows me knows I'm probably more direct than courteous. I'm very direct and if I know it I will tell you what it is, and if I don't I'll tell you I don't know, but I'll find out. I don't come to these meetings to try to pull the wool over anybody's eyes."
Project critics, as they have whenever the solar facility has been the subject of a public meeting, spoke critically of use of technology that will consume groundwater. They repeated their concern that the water is consumed locally to generate power that will be sold elsewhere to the highest bidder.
Project officials and their supporters repeated their point that the power plant will serve as a stimulus to the local economy and take a necessary progressive step forward as the nation turns to cleaner energy production and the need to wean itself of its foreign oil dependance. They again noted the 1,000 jobs that would be provided during project construction and the 100-plus people who would be put to work to run the facility.
The discussion gobbled up about two hours, and the Commission adjourned the meeting without voting on Albiassa matters or other requests related to the larger Hualapai Valley Solar facility proposed north of Kingman. Both projects were to come back before the Commission in a continued hearing scheduled September 16.
(Look to future editions of the Standard for continued coverage of the solar power project proposals)
Wednesday, September 09, 2009

Saturday, September 05, 2009
Well... it is that time
Hey folks, first I want to say what an honor it is for me that you have stopped by to read anything that is written here at MOCO. This blog is about three and a half years old now, and all throughout there have been changes. Today comes a bigger change.
You look at the top and you will see that the blog's title has changed. We are now MOCO Real Politics. The goals still remain the same though, honest opinion and relevant research of the pressing issues of the day. There will be no shortage of either as we move forward.
Some of you know that I am leaving the area that I have called home for nearly the last ten years. I can say that I don't often share my personal family information here at this blog, but in this case part of the reason I am making the change is to once again join my wife on a more permanent basis under one roof. We have lived apart for nearly two years. In many ways the experiences have been easier than expected... and we've certainly had fun (nothing like total control of the remote control... and Gail would say the very same thing).
But new opportunities have revealed themselves to both my wife and me and we are looking forward to new challenges in New Mexico. Now that is not to say that we are leaving behind this area in northwestern Arizona. In fact we both love it here and know that if we make good on our opportunities that it would allow us the choice to re-relocate back home. For the time being though, we will have to make due with frequent visits to Kingman.
Luckily for me, with all of the interest that I have in this great community, I'll only be an Internet connection away. This is why I am keeping this blog in existence, and I hope to grow it even though I won't be physically here.
I've asked a few people to help contribute to the blog. So if you don't recognize the writing style or even the format of a new post, be sure to look below the post for the actual author.
I'd like to have even more contributors so if you are interested in offering your information and opinion on the political happenings in the Mohave County area, please email me by clicking on the 'email Todd' button on the sidebar. I'll even open it up to folks that may not want to use their real name as a contributor, perhaps you'll feel more comfortable using an online moniker. But in order to do that, I will at least have to know who you are. We'll work that out via email an phone.
The goal is to get more conversations going about the important issues. It is about bringing more voices into the fold, more collaboration efforts to find pleasing solutions for a greater percentage of the friends and neighbors here in Kingman and beyond. Trust me, you can help and that is why I ask you to contribute.
As for residential real estate related data and the monthly reports I have offered up over the last three plus years... I plan on continuing the sales report that I produce ten or so days into the month that covers what took place the prior month. As I mentioned in the listings report a few days ago, I'm not as certain if I will keep that report going... it will just depend on time constraints. If I think that I cannot continue that report, I will announce that change.
I still have an active real estate license and am still a member of the local, state, and national association of Realtors. It is my intention to help anyone that needs real estate services in this area as best as I can. Even if that means coming back to the area to provide the real estate related services. If I am unable to provide that service, I certainly can point an interested person to the right direction of an agent or broker that can.
For the last few months I have been a part of a podcast called 'Mohave Real Talk' and the plan there is to continue those podcasts with my good friend and excellent real estate broker in Bullhead City, Evan Fuchs. I know some of you can't hardly wait for the next episode as they arrive, so I will be sure to announce when the new podcasts are available on this blog, and via Twitter and Facebook.
Perhaps it might seem like I never left. What a wonderful thing this here Internet doo-hickey is.
As for the title change of the blog, I simply feel there is not enough focus on political issues here in this area and this blog will do whatever it can to shed light on important community issues. There will be attempts to have email interviews with community leaders so that we can all have a chance to see what is on the minds of our leaders. And if possible, even video interviews to share.
Bottom line here, I urge you to get involved in the community and I can at least offer you a platform here at MOCO. Please feel compelled to use the comments if you do not want to publish your own contributions. Beyond MOCO though, attend a public meeting at either the county or the city. Speak in front of the governing bodies on an issue at those meetings. Watch the meetings on local access TV or via an Internet connection. Ask questions, demand answers of our local public servants that have the privilege of our votes.
The one key issue that I believe in strongly is the protection of private property rights. Those rights extend beyond real estate, please keep that in mind. I believe that these rights are being threatened by not only the local governments at times, but also by some folks that really have no concept of the rights until they too are faced with something that could threaten their own rights.
Without a doubt, the community will lose valuable property rights before we ever run out of water. I plan on researching more about the protection of private property rights and the things that we can do to ensure we always have them (just like we will always have water here). You can bet that I will share all of the pertinent information about property rights so you will stay in the know.
My next post will be published from New Mexico, but just so you know it won't be the first post that I published from New Mexico or Minnesota or Florida or Nevada or many other places. This will be the 1,030th post on MOCO... help me push this total over 2,000 posts in the next few years.
God bless you all, thanks again from the bottom of my heart for your visits to MOCO. I look forward to seeing you all back many more times as you will always be welcome. I also look forward to seeing many of you in person as I come back to Kingman for frequent visits.
Better days ahead!!
You look at the top and you will see that the blog's title has changed. We are now MOCO Real Politics. The goals still remain the same though, honest opinion and relevant research of the pressing issues of the day. There will be no shortage of either as we move forward.
Some of you know that I am leaving the area that I have called home for nearly the last ten years. I can say that I don't often share my personal family information here at this blog, but in this case part of the reason I am making the change is to once again join my wife on a more permanent basis under one roof. We have lived apart for nearly two years. In many ways the experiences have been easier than expected... and we've certainly had fun (nothing like total control of the remote control... and Gail would say the very same thing).
But new opportunities have revealed themselves to both my wife and me and we are looking forward to new challenges in New Mexico. Now that is not to say that we are leaving behind this area in northwestern Arizona. In fact we both love it here and know that if we make good on our opportunities that it would allow us the choice to re-relocate back home. For the time being though, we will have to make due with frequent visits to Kingman.
Luckily for me, with all of the interest that I have in this great community, I'll only be an Internet connection away. This is why I am keeping this blog in existence, and I hope to grow it even though I won't be physically here.
I've asked a few people to help contribute to the blog. So if you don't recognize the writing style or even the format of a new post, be sure to look below the post for the actual author.
I'd like to have even more contributors so if you are interested in offering your information and opinion on the political happenings in the Mohave County area, please email me by clicking on the 'email Todd' button on the sidebar. I'll even open it up to folks that may not want to use their real name as a contributor, perhaps you'll feel more comfortable using an online moniker. But in order to do that, I will at least have to know who you are. We'll work that out via email an phone.
The goal is to get more conversations going about the important issues. It is about bringing more voices into the fold, more collaboration efforts to find pleasing solutions for a greater percentage of the friends and neighbors here in Kingman and beyond. Trust me, you can help and that is why I ask you to contribute.
As for residential real estate related data and the monthly reports I have offered up over the last three plus years... I plan on continuing the sales report that I produce ten or so days into the month that covers what took place the prior month. As I mentioned in the listings report a few days ago, I'm not as certain if I will keep that report going... it will just depend on time constraints. If I think that I cannot continue that report, I will announce that change.
I still have an active real estate license and am still a member of the local, state, and national association of Realtors. It is my intention to help anyone that needs real estate services in this area as best as I can. Even if that means coming back to the area to provide the real estate related services. If I am unable to provide that service, I certainly can point an interested person to the right direction of an agent or broker that can.
For the last few months I have been a part of a podcast called 'Mohave Real Talk' and the plan there is to continue those podcasts with my good friend and excellent real estate broker in Bullhead City, Evan Fuchs. I know some of you can't hardly wait for the next episode as they arrive, so I will be sure to announce when the new podcasts are available on this blog, and via Twitter and Facebook.
Perhaps it might seem like I never left. What a wonderful thing this here Internet doo-hickey is.
As for the title change of the blog, I simply feel there is not enough focus on political issues here in this area and this blog will do whatever it can to shed light on important community issues. There will be attempts to have email interviews with community leaders so that we can all have a chance to see what is on the minds of our leaders. And if possible, even video interviews to share.
Bottom line here, I urge you to get involved in the community and I can at least offer you a platform here at MOCO. Please feel compelled to use the comments if you do not want to publish your own contributions. Beyond MOCO though, attend a public meeting at either the county or the city. Speak in front of the governing bodies on an issue at those meetings. Watch the meetings on local access TV or via an Internet connection. Ask questions, demand answers of our local public servants that have the privilege of our votes.
The one key issue that I believe in strongly is the protection of private property rights. Those rights extend beyond real estate, please keep that in mind. I believe that these rights are being threatened by not only the local governments at times, but also by some folks that really have no concept of the rights until they too are faced with something that could threaten their own rights.
Without a doubt, the community will lose valuable property rights before we ever run out of water. I plan on researching more about the protection of private property rights and the things that we can do to ensure we always have them (just like we will always have water here). You can bet that I will share all of the pertinent information about property rights so you will stay in the know.
My next post will be published from New Mexico, but just so you know it won't be the first post that I published from New Mexico or Minnesota or Florida or Nevada or many other places. This will be the 1,030th post on MOCO... help me push this total over 2,000 posts in the next few years.
God bless you all, thanks again from the bottom of my heart for your visits to MOCO. I look forward to seeing you all back many more times as you will always be welcome. I also look forward to seeing many of you in person as I come back to Kingman for frequent visits.
Better days ahead!!
Thursday, September 03, 2009
Time for another fun public meeting...
A friendly reminder that one of the proposed solar power plants will be a topic for a public hearing on the Mohave County Planning and Zoning agenda next Wednesday, September the 9th (item numbers 22A and 22B on page 7 at the link).
Below you will find a letter that was prepared by an associate of the firm that is seeking to develop the new renewable energy plant right here in our collective back yard. Please note that the following words are not mine, they come straight from the Hualapai Valley Solar group. You will see information that they are providing, including some response to the nonsense of the water worry warts and the crappy propaganda they continue to offer.
No matter what side of the issue you may already be on, please give the following a read. At the end of the post I will link to all the local elected officials from the city council of Kingman on up to the state legislative representatives. If you so choose, let them know your views on this very important issue.
The letter will be italicized and begins now...
September 1, 2009
To: Friends of the Hualapai Valley Solar Project near Red Lake
On Wednesday, September 9, the Mohave County Planning & Zoning Commission will review our General Plan Amendment and Area Plan. Development Services staff is recommending their approval. We encourage you to participate by signing a Letter of Support and/or by signing up to speak at the P&Z hearing – this is your chance to take an active role in shaping the future of Mohave County.
Many of you have heard me speak at our open houses and public meetings, or at events sponsored by the many civic organizations in Kingman. By now, you understand that our Project site near Red Lake is a world-class solar site – it is flat, very remote, has sparse vegetation and no protected species, and is adjacent to multiple transmission lines. Many proposed renewable energy projects are “like trying to push a square peg into a round hole”. But near Red Lake, everything fits, and this is something that the people of Mohave County should embrace! Besides the obvious benefits of developing U.S. renewable energy, reducing global warming, and reducing U.S. dependence on foreign oil (and therefore our foreign trade deficit), the Hualapai Valley Solar project will directly benefit Mohave County in many ways:
• New jobs – 1,500 at the peak of our 3-year construction period and 105+ during operation
• Substantial tax revenue – an estimated $4+ million per year in property taxes
• An estimated overall impact of more than $20 million per year, and this does not include:
o Revenue to the City of Kingman for the sale of effluent (treated wastewater)
o Revenue from tourist visits to our Visitors Center.
As a responsible developer, Mohave Sun Power will continue to build its stewardship in our community. To date, we have invested in many local relationships, including:
• Local consultants, engineers, subcontractors, utilities and suppliers
• Job training programs such as the new, county-wide Joint Technological Education District (JTED)
• Working as a member of the Kingman Area Chamber of Commerce, helping to identify the substantial opportunities for the local business community.
Critics of our Project continue to present misinformation about our water usage. The facts are:
• After 2 years of study, ADWR issued a Letter of Assured Water Supply that includes our site, for the equivalent of approximately 9,000 acre-feet per year. Our Project will use 2,400 acre-feet per year, effectively retiring (not using) 6,600 acre-feet per year.
• Errol Montgomery & Associates completed a hydrologic study showing that there are more than 15.7 million acre-feet of easily accessible water in the Hualapai Valley Basin within 1,200 feet of the ground surface, with even more below that mark.
• Of the 2,400 acre-feet per year we would use, we expect to purchase up to 1,700 acrefeet per year of effluent from the City of Kingman. A pipeline will bring the effluent from the new Hilltop Wastewater Treatment Plant to our site. The City currently has no other buyer for this effluent, which will likely be evaporated (as it is today) if we do not reuse it.
• If the new Hilltop plant and our Project were operational today, the result would be that we would pump roughly the same amount of water used by either of the 18-hole golf courses in the area (each with considerably less local economic impact than our Project).
• The Hilltop treatment plant is designed to support growth – any increase in the output of the Hilltop plant (due to population growth or redirecting other City wastewater) will likely result in our Project using 100% effluent for our cooling needs.
• Our Project recycles the cooling water more than 55 times, and we will continue to evaluate and implement other innovative techniques for conserving and reusing water.
For nearly a year, Mohave Sun Power has been working diligently and responsibly, developing the Project near Red Lake. During that time, the Project has been greatly improved through the feedback and constructive ideas presented by local residents.
Citizens should continue to scrutinize proposed projects, and support responsible developments in these difficult financial times. Critics often have the loudest voices, while supporters sit on the sidelines. We would like to turn that tide, to ensure that the best developments are realized.
Please consider signing a Letter of Support for the Hualapai Valley Solar project.
Thank you for your time and consideration,
Greg Bartlett, Project Director
The next part is up to you... not me... you. You may decide to let your county and city leaders know how you stand on this particular issue. You now have some information that you can use to help base your decision on -- at the very least somewhere to start if you want to question the information further. All of what comes next is on YOU.
Below I am linking email addresses to local elected leaders and other officials. Please take a moment, if you choose to do so, and let these folks know where it is you stand on this very important issue.
Mohave County officials...
District 1 Supervisor Gary Watson
gary.watson@co.mohave.az.us
District 2 Supervisor Tom Sockwell
Tom.Sockwell@co.mohave.az.us
District 3 Supervisor Buster Johnson
Buster.Johnson@co.mohave.az.us
City of Kingman officials...
Mayor of Kingman John Salem
jsalem@cityofkingman.gov
Vice Mayor of Kingman Janet Watson
jwatson@cityofkingman.gov
Council Member Carole Young
cyoung@cityofkingman.gov
Council Member Kerry Deering
kdeering@cityofkingman.gov
Council Member Ray Lyons
rlyons@cityofkingman.gov
Council Member Robin Gordon
regordon@cityofkingman.gov
Council Member Keith Walker
klwalker@cityofkingman.gov
City of Kingman City Manager Jack Kramer
jkramer@cityofkingman.gov
Arizona State Legislative Representatives...
Representative Doris Goodale
dgoodale@azleg.gov
Representative Nancy McLain
nmclain@azleg.gov
Senator Ron Gould
rgould@azleg.gov
Thank you to anyone that decides to take the time to let our elected leaders and officials know how we feel about these opportunities at this time. If you do decide to drop an email or a phone call, or simply a visit in person... tell 'em MOCO sent you.
Below you will find a letter that was prepared by an associate of the firm that is seeking to develop the new renewable energy plant right here in our collective back yard. Please note that the following words are not mine, they come straight from the Hualapai Valley Solar group. You will see information that they are providing, including some response to the nonsense of the water worry warts and the crappy propaganda they continue to offer.
No matter what side of the issue you may already be on, please give the following a read. At the end of the post I will link to all the local elected officials from the city council of Kingman on up to the state legislative representatives. If you so choose, let them know your views on this very important issue.
The letter will be italicized and begins now...
September 1, 2009
To: Friends of the Hualapai Valley Solar Project near Red Lake
On Wednesday, September 9, the Mohave County Planning & Zoning Commission will review our General Plan Amendment and Area Plan. Development Services staff is recommending their approval. We encourage you to participate by signing a Letter of Support and/or by signing up to speak at the P&Z hearing – this is your chance to take an active role in shaping the future of Mohave County.
Many of you have heard me speak at our open houses and public meetings, or at events sponsored by the many civic organizations in Kingman. By now, you understand that our Project site near Red Lake is a world-class solar site – it is flat, very remote, has sparse vegetation and no protected species, and is adjacent to multiple transmission lines. Many proposed renewable energy projects are “like trying to push a square peg into a round hole”. But near Red Lake, everything fits, and this is something that the people of Mohave County should embrace! Besides the obvious benefits of developing U.S. renewable energy, reducing global warming, and reducing U.S. dependence on foreign oil (and therefore our foreign trade deficit), the Hualapai Valley Solar project will directly benefit Mohave County in many ways:
• New jobs – 1,500 at the peak of our 3-year construction period and 105+ during operation
• Substantial tax revenue – an estimated $4+ million per year in property taxes
• An estimated overall impact of more than $20 million per year, and this does not include:
o Revenue to the City of Kingman for the sale of effluent (treated wastewater)
o Revenue from tourist visits to our Visitors Center.
As a responsible developer, Mohave Sun Power will continue to build its stewardship in our community. To date, we have invested in many local relationships, including:
• Local consultants, engineers, subcontractors, utilities and suppliers
• Job training programs such as the new, county-wide Joint Technological Education District (JTED)
• Working as a member of the Kingman Area Chamber of Commerce, helping to identify the substantial opportunities for the local business community.
Critics of our Project continue to present misinformation about our water usage. The facts are:
• After 2 years of study, ADWR issued a Letter of Assured Water Supply that includes our site, for the equivalent of approximately 9,000 acre-feet per year. Our Project will use 2,400 acre-feet per year, effectively retiring (not using) 6,600 acre-feet per year.
• Errol Montgomery & Associates completed a hydrologic study showing that there are more than 15.7 million acre-feet of easily accessible water in the Hualapai Valley Basin within 1,200 feet of the ground surface, with even more below that mark.
• Of the 2,400 acre-feet per year we would use, we expect to purchase up to 1,700 acrefeet per year of effluent from the City of Kingman. A pipeline will bring the effluent from the new Hilltop Wastewater Treatment Plant to our site. The City currently has no other buyer for this effluent, which will likely be evaporated (as it is today) if we do not reuse it.
• If the new Hilltop plant and our Project were operational today, the result would be that we would pump roughly the same amount of water used by either of the 18-hole golf courses in the area (each with considerably less local economic impact than our Project).
• The Hilltop treatment plant is designed to support growth – any increase in the output of the Hilltop plant (due to population growth or redirecting other City wastewater) will likely result in our Project using 100% effluent for our cooling needs.
• Our Project recycles the cooling water more than 55 times, and we will continue to evaluate and implement other innovative techniques for conserving and reusing water.
For nearly a year, Mohave Sun Power has been working diligently and responsibly, developing the Project near Red Lake. During that time, the Project has been greatly improved through the feedback and constructive ideas presented by local residents.
Citizens should continue to scrutinize proposed projects, and support responsible developments in these difficult financial times. Critics often have the loudest voices, while supporters sit on the sidelines. We would like to turn that tide, to ensure that the best developments are realized.
Please consider signing a Letter of Support for the Hualapai Valley Solar project.
Thank you for your time and consideration,
Greg Bartlett, Project Director
The next part is up to you... not me... you. You may decide to let your county and city leaders know how you stand on this particular issue. You now have some information that you can use to help base your decision on -- at the very least somewhere to start if you want to question the information further. All of what comes next is on YOU.
Below I am linking email addresses to local elected leaders and other officials. Please take a moment, if you choose to do so, and let these folks know where it is you stand on this very important issue.
Mohave County officials...
District 1 Supervisor Gary Watson
gary.watson@co.mohave.az.us
District 2 Supervisor Tom Sockwell
Tom.Sockwell@co.mohave.az.us
District 3 Supervisor Buster Johnson
Buster.Johnson@co.mohave.az.us
City of Kingman officials...
Mayor of Kingman John Salem
jsalem@cityofkingman.gov
Vice Mayor of Kingman Janet Watson
jwatson@cityofkingman.gov
Council Member Carole Young
cyoung@cityofkingman.gov
Council Member Kerry Deering
kdeering@cityofkingman.gov
Council Member Ray Lyons
rlyons@cityofkingman.gov
Council Member Robin Gordon
regordon@cityofkingman.gov
Council Member Keith Walker
klwalker@cityofkingman.gov
City of Kingman City Manager Jack Kramer
jkramer@cityofkingman.gov
Arizona State Legislative Representatives...
Representative Doris Goodale
dgoodale@azleg.gov
Representative Nancy McLain
nmclain@azleg.gov
Senator Ron Gould
rgould@azleg.gov
Thank you to anyone that decides to take the time to let our elected leaders and officials know how we feel about these opportunities at this time. If you do decide to drop an email or a phone call, or simply a visit in person... tell 'em MOCO sent you.
Wednesday, September 02, 2009
No jobs, but plenty of water...
Truly horrible for the area is the news that appears today at the KDMiner.com website...
Meanwhile, the shower worked this morning. Plenty enough water to brush the teeth. I managed my normal two glasses of water for drinking. And oh yes the toilet worked just fine.
It is becoming clear, this community must choose to either use the assets it has to attract more industry and commercial opportunities -- and the vast quantity of water in the aquifers is just one of those assets, or accept the fate that this area is dying a painful death.
Released Tuesday morning, the Metropolitan Area Employment and Unemployment Summary shows that total employment for the Kingman-Lake Havasu metropolitan area fell 9.3 percent from July 2008 to July 2009, the sharpest year-over-year decline among all 372 metro areas monitored by the BLS. Another Arizona city, Prescott, came second, shedding 8.9 percent of its workforce over the same time period, with Reno, Nev., coming in third at 8.4 percent.
Meanwhile, the shower worked this morning. Plenty enough water to brush the teeth. I managed my normal two glasses of water for drinking. And oh yes the toilet worked just fine.
It is becoming clear, this community must choose to either use the assets it has to attract more industry and commercial opportunities -- and the vast quantity of water in the aquifers is just one of those assets, or accept the fate that this area is dying a painful death.
Tuesday, September 01, 2009
August Listings Report (2009)
More fun with data found in this post, this time though a bit more traditional data for this blog. The listings report this month does have some highlights, the main one being that total pending contracts are up compared to last year a whopping 119%. It's almost as if the buyers and sellers have really started to understand each other... well banks and buyers certainly.
One other note of interest before moving on to the data tables... I just did a quick calculation to look at how many months worth of inventory is on the market compared to how many buyers are active. Basically we have whittled down the inventory level to a little less than six months. In normal conditions that is a balanced market. Alas... this isn't a garden variety market. When I break out the foreclosed properties from the traditional seller listings, we still see less than a month worth of inventory for banks and foreclosures... leaving traditional sellers a bit over nine months of inventory. Another way to look at it is say on the day you come back from the doctor who tells you and your significant other that you are expecting a new baby in nine months, put your home up on the market. The average says that by the time the doctor delivers the baby, your friendly Realtor will deliver you a contract to purchase your home.
Alright, let's go already... disclaimer first of course...
Disclaimer... all data compiled for this report comes from the WARDEX Data Exchange and does not include any sales activity from outside that resource. All research is done only on single family homes and there is no inclusion of modular homes, commercial properties, or vacant land. The geographical area researched includes; all areas within the boundaries of the city of Kingman, north Kingman, the Hualapai Mountain area, and the Valle Vista subdivisions. Click here to see maps of the included area's.
From my perspective, the data has moved in the right direction on the listing data for last month. Of course I'm not a seller though, so I'd understand that if you were a seller you might not see things the same way.
Also noted, the average asking price for last month marked the lowest such figure since I've been keeping track of the data. It is the lowest figure in that category by far as well. The lowest previously was $151,747 back in June of 2009 (a few months ago). Sellers seem to be getting serious about selling.
Of the 28 new listings taken in August, 18 of them are the foreclosed variety and there were also two new listings in August that have already closed escrow... you bet, both were foreclosures.
Plenty of solid activity for new contracts. New contract levels haven't been below 70 since last February. Of course foreclosure activity is lapping the field and gets credit for more than half the activity so far this year in new contracts. While foreclosures offer the best price and affordability... keep in mind that they don't always offer the best value. For traditional sellers, the key is to blur that line and you'll have to use a lower price to make that happen in most cases.
So let's take a look at year over year data now...
Year over year data listings/pending contracts
I wrote about inventory issues earlier in this post, no need to do so again. New listings down and new contracts up... pretty much the best news one could hope for in this market. The prices will figure themselves out as more of the market finds some semblance of balance. For now though the prices on both new listings and the marketing price for new contracts continues to correct south.
And now for a programming note... at this point I'm not certain, but there is a chance that this could be my last listings report that I offer on this blog. Some of you know that a new location awaits my arrival and my schedule could be a bit more complicated. You see, I run these numbers for this report in the morning on the first day of the month... and produce this report on the same day. I think only one other time did I not get the report published on the first day, but I managed to collect the data on first day.
I'm not totally sure if I'll be able to continue this report as it stands right now. So just in case, enjoy this listings report and hopefully I'll see you next month with another episode.
One other note of interest before moving on to the data tables... I just did a quick calculation to look at how many months worth of inventory is on the market compared to how many buyers are active. Basically we have whittled down the inventory level to a little less than six months. In normal conditions that is a balanced market. Alas... this isn't a garden variety market. When I break out the foreclosed properties from the traditional seller listings, we still see less than a month worth of inventory for banks and foreclosures... leaving traditional sellers a bit over nine months of inventory. Another way to look at it is say on the day you come back from the doctor who tells you and your significant other that you are expecting a new baby in nine months, put your home up on the market. The average says that by the time the doctor delivers the baby, your friendly Realtor will deliver you a contract to purchase your home.
Alright, let's go already... disclaimer first of course...
Disclaimer... all data compiled for this report comes from the WARDEX Data Exchange and does not include any sales activity from outside that resource. All research is done only on single family homes and there is no inclusion of modular homes, commercial properties, or vacant land. The geographical area researched includes; all areas within the boundaries of the city of Kingman, north Kingman, the Hualapai Mountain area, and the Valle Vista subdivisions. Click here to see maps of the included area's.
Data tables for all new listings tracked in the month of August 2009
| Item | Total Units | Previous Month |
|---|---|---|
| Total Listings On Market | 426 | 445 |
| Total Listings Listed as Foreclosed | 62 | 68 |
| Item | Month of August | Previous Month |
|---|---|---|
| New Listings Total | 105 | 130 |
| New Listings Listed as Foreclosed | 43 | 49 |
| Average Asking Price Per Unit | $133,546 | $177,634 |
| Median Asking Price | $109,950 | $125,900 |
| Average Asking Price Per Square Foot | $84 | $104 |
| Units Re-Listed | 11 | 14 |
| Units Already Under Contract | 28 | 22 |
| Item | Month of August | Previous Month |
|---|---|---|
| Living Area Square Footage | 1,582 | 1,701 |
| Bedrooms | 2.97 | 3.15 |
| Bathrooms | 2.06 | 2.18 |
| Garage | 1.89 | 2.18 |
| Year Built | 1991 | 1995 |
| Item | Lowest | Highest |
| Listings | $21,285 | $599,900 |
From my perspective, the data has moved in the right direction on the listing data for last month. Of course I'm not a seller though, so I'd understand that if you were a seller you might not see things the same way.
Also noted, the average asking price for last month marked the lowest such figure since I've been keeping track of the data. It is the lowest figure in that category by far as well. The lowest previously was $151,747 back in June of 2009 (a few months ago). Sellers seem to be getting serious about selling.
Of the 28 new listings taken in August, 18 of them are the foreclosed variety and there were also two new listings in August that have already closed escrow... you bet, both were foreclosures.
Data tables for all new Units under contract tracked in the month of August 2009
| Item | Total Units | Previous Month |
|---|---|---|
| Total Units Under Contract | 162 | 139 |
| Total Contracts Listed as Foreclosed | 76 | 62 |
| Item | Month of August | Previous Month |
|---|---|---|
| New Contracts Total | 84 | 82 |
| New Contracts Listed as Foreclosed | 44 | 41 |
| Average Marketing Price Per Unit | $118,501 | $124,010 |
| Median Marketing Price | $101,998 | $104,900 |
| Average Marketing Price Per Square Foot | $77 | $80 |
| Days on Market to Acquire a Contract | 94 | 100 |
| Average Marketing Price Reduction | $12,828 | $14,227 |
| Item | Month of August | Previous Month |
|---|---|---|
| Living Area Square Footage | 1,545 | 1,552 |
| Bedrooms | 3.02 | 3.02 |
| Bathrooms | 2.03 | 2.11 |
| Garage | 1.87 | 2.05 |
| Year Built | 1993 | 1996 |
| Item | Lowest | Highest |
| Listings | $24,900 | $299,900 |
Plenty of solid activity for new contracts. New contract levels haven't been below 70 since last February. Of course foreclosure activity is lapping the field and gets credit for more than half the activity so far this year in new contracts. While foreclosures offer the best price and affordability... keep in mind that they don't always offer the best value. For traditional sellers, the key is to blur that line and you'll have to use a lower price to make that happen in most cases.
So let's take a look at year over year data now...
Year over year data listings/pending contracts
| Item | UP/DOWN | unit/dollar amount | Percentage |
|---|---|---|---|
| Total Listings | DOWN | 205 | (32.5%) |
| New Listings in August | DOWN | 22 | (17%) |
| Average Price per New Listing | DOWN | $43,349 | (24.5%) |
| Median List Price | DOWN | $50,050 | (31%) |
| Item | UP/DOWN | unit/dollar amount | Percentage |
|---|---|---|---|
| Total Pending Contracts | UP | 88 | 119% |
| New Contracts for August | UP | 36 | 75% |
| Average Marketing Price per Unit | DOWN | $30,737 | (20.5%) |
| Median Marketing Price | DOWN | $36,902 | (26.5%) |
I wrote about inventory issues earlier in this post, no need to do so again. New listings down and new contracts up... pretty much the best news one could hope for in this market. The prices will figure themselves out as more of the market finds some semblance of balance. For now though the prices on both new listings and the marketing price for new contracts continues to correct south.
And now for a programming note... at this point I'm not certain, but there is a chance that this could be my last listings report that I offer on this blog. Some of you know that a new location awaits my arrival and my schedule could be a bit more complicated. You see, I run these numbers for this report in the morning on the first day of the month... and produce this report on the same day. I think only one other time did I not get the report published on the first day, but I managed to collect the data on first day.
I'm not totally sure if I'll be able to continue this report as it stands right now. So just in case, enjoy this listings report and hopefully I'll see you next month with another episode.
Monday, August 31, 2009
Fun with data... from the USGS water report (UPDATED)
In the comments from my last blog post, frequent commenter and soon to be contributor here at MOCO provided a link to the USGS report with the following name...
Ground-Water Occurrence and Movement, 2006, and Water-Level Changes in the Detrital, Hulapai, and Sacramento Valley Basins, Mohave County, Arizona
... whew!! That is a long title to a report.
Donna was nice enough to give me a paper copy of this report last year at some point. It has been sitting in my office ever since. I have cracked it open a few times to give it a read, it can be interesting if you are into that sort of stuff -- or perhaps if you are 'enlightened' (and sadly I am not according to the water worry warts). For the most part, I'm not into that report. I admit that I have very limited knowledge of water; where it comes from and how it ends up falling from my incredibly luxurious shower head.
However, I checked out the link that Donna left in the comments. And online, there is data to be found in the Appendixes. See this link for the list of the various ways that you too can view the data. I obviously clicked on the .xls link to open a spread sheet because I just love me some data in the afternoon, especially data that deals with 'net water level change' that was reported on 208 wells found in Mohave County in the three aquifers referred to in the long title of the document.
Oh you should see the data in all its glory. But click on that (appendix #2) for yourself. I'll need you to check my math... and folks that is all I'm providing in this blog post. Just some math. I do not pretend to be 'enlightened' about all things water... I certainly did not attend college to get a degree in hydrology (more like booze, babes, and parties -- no wonder I didn't finish)... all I'm doing is mining the data... and please check my math (as you now know what I was up to in my learning years).
Before moving on to the data, I have been told something about this report (that you can read online). According to the source of the information... the data in this report IS the data that will come out in the final USGS report sometime in 2010. The same report that some water worry warts say that we should wait on before we allow for more growth opportunities to flourish here in this community. Now I can't corroborate on this. I frankly do not know if this is the data that will be used in this long awaited for USGS report or not... really I don't. And I'm not here to say that it is. But it is a report offered by the USGS and it was prepared in cooperation with the Arizona Department of Water Resources (ADWR).
All I know is that the report was done by these government agencies and that they were nice enough to include an .xls link to a spread sheet with the data they reported on. It is this data that I will focus on in this post.
So are you ready?? (Dang, you could have read the whole USGS report by now instead of reading the lead up to the data findings that I'm about to share)
As I mentioned earlier, this USGS report has data on 208 existing wells, all within the three aquifers in Mohave County. The average water level change for all 208 wells shows an average loss of 1.75 feet from the time the water level of each well was originally read through to sometime in the year 2006.
Oh... you just know I'm not going to stop there. Much more breaking down of the data to do. But I'm starting with the overall figures for all of the 208 wells in the report.
Did you know of the 208 wells that 113 of them have actually had an increase in water level?? That is right, more than half of the wells studied have increased in water levels since they were first read and records kept. Before we start to party, 90 wells have decreased in water level. The remaining 5 recorded no change.
The figures for the 5 wells that saw the biggest drop in water level from the beginning of records through to 2006 were as follows; 134.8 feet, 69.9 feet, 66.7 feet, 55.7 feet, 52.7 feet. Now the figures for the 5 wells that saw the biggest increase in water level were as follows; 107.8 feet, 48.8 feet, 47.8 feet, 43.7 feet, 41.1 feet. The median figure for all 208 wells showed an increase of .4 feet.
As I moved along with my handy dandy data and spreadsheet, I saw the need to break out information from each aquifer... and I will do that below. But keep in mind something else and that is the element of time. You see not all of these water levels were originally recorded in the same year. Recording first started on 28 wells in 1963 through 1965 (according to the data). In 1978 through 1980 another 64 wells had their water levels first recorded. Then in 1995 and 1996 the government found the time to record the water levels in 116 additional wells (if you are checking my math at home, 28 + 64 + 116 = 208, right??). So yeah, of course I needed to break out the data further... and I will... but the following data is an overall look at the wells in each of the three aquifers according to the USGS report.
In the Hualapai Valley aquifer there are 100 wells. Measured in feet, the average net water level change shows a negative 5.41 feet per well.
There are 17 wells in the Detrital Valley aquifer and the average net water level changes shows a negative 4.22 feet per well.
Again folks, I'm doing averages here.
Now in the Sacramento Valley aquifer there are 91 wells and I found that the net water level change actually showed an increase of 2.73 feet per well. Yep, that is right, an increase in the average water level. How about that?? In a desert no less. A desert in a drought.
Math check... 100 + 17 + 91 = 208 right??
I could stop right here but the element of time had me intrigued to see what the averages might show over the varying lengths of time. The net water level changes (NWLC) for the wells originally recorded around 1964 (42 years) show an average loss in each well of 1.6 feet. The NWLC for the wells originally recorded around 1980 (26 years) show an average loss in each well of 0.8 feet. The NWLC for the wells originally recorded around 1996 (10 years) show an average loss in each well of 2.3 feet.
Now for the fun stuff, I'll be breaking the data down by year and by aquifer... this will be fun I promise.
I'll start with the Detrital Valley aquifer. It has the least amount of wells and there were only two time frames where original recording of water levels were done (three in each of the other aquifers).
There was one well that had an original recording from the 1964 era. That well has since increase its NWLC by 6.2 feet... an average annual increase of 0.148 feet a year. (Doing the math at home?? I divided the 6.2 figure by 42 years and I will use 42 years for all the of the 1964 era original water level recordings from here on out... 26 for the 1980 era water level recordings... and 10 for the 1996 era water level recordings). The other 16 wells showed an average drop in NWLC of 4.875 feet per well... an average decrease of 0.488 feet per well per year.
Still following?? Still two more aquifers to go.
Now we'll tackle the Sacramento Valley aquifer. There are 16 wells in that aquifer that recorded the original water level from the 1964 era. The average NWLC shows a decrease of 0.9 feet per well... an average decrease of 0.02 feet per year. There are 30 wells in this aquifer that first recorded water level in the 1980 era. The average NWLC for these wells shows an increase of 6.9 feet per well... an average increase of 0.265 feet per year. There are 45 wells in the aquifer that recorded water level in the 1995 era. The average NWLC for these wells shows an increase of 1.232 feet per well... an average increase of .123 feet per year.
One more to go... at a later time I may put together a table for easier viewing but don't have the time for that right now.
Last up is the Hualapai Valley aquifer. There are 11 wells in this aquifer that first recorded water level in the 1964 era. The average NWLC shows a decrease of 3.5 feet per well... an average decrease of 0.082 feet per year. There are 34 wells in the aquifer that first recorded water level in the 1980 era. The average NWLC shows a decrease of 7.6 feet per well... an average decrease of 0.294 per year. There are 55 wells in the aquifer that first recorded water level in the 1996 era. The average NWLC shows a decrease of 4.435 feet per well... an average decrease of 0.443 per year.
And there you go. Just the data and nothing but the data. Like I said earlier, I may put together a table that makes it easier to read the data that I broke out. Just don't have the time at the moment.
Draw you own conclusions and share them in the comments. Would love to see some input from the water worry warts as well. What does this data mean?? Your turn.
Post updated for data tables...
Ground-Water Occurrence and Movement, 2006, and Water-Level Changes in the Detrital, Hulapai, and Sacramento Valley Basins, Mohave County, Arizona
... whew!! That is a long title to a report.
Donna was nice enough to give me a paper copy of this report last year at some point. It has been sitting in my office ever since. I have cracked it open a few times to give it a read, it can be interesting if you are into that sort of stuff -- or perhaps if you are 'enlightened' (and sadly I am not according to the water worry warts). For the most part, I'm not into that report. I admit that I have very limited knowledge of water; where it comes from and how it ends up falling from my incredibly luxurious shower head.
However, I checked out the link that Donna left in the comments. And online, there is data to be found in the Appendixes. See this link for the list of the various ways that you too can view the data. I obviously clicked on the .xls link to open a spread sheet because I just love me some data in the afternoon, especially data that deals with 'net water level change' that was reported on 208 wells found in Mohave County in the three aquifers referred to in the long title of the document.
Oh you should see the data in all its glory. But click on that (appendix #2) for yourself. I'll need you to check my math... and folks that is all I'm providing in this blog post. Just some math. I do not pretend to be 'enlightened' about all things water... I certainly did not attend college to get a degree in hydrology (more like booze, babes, and parties -- no wonder I didn't finish)... all I'm doing is mining the data... and please check my math (as you now know what I was up to in my learning years).
Before moving on to the data, I have been told something about this report (that you can read online). According to the source of the information... the data in this report IS the data that will come out in the final USGS report sometime in 2010. The same report that some water worry warts say that we should wait on before we allow for more growth opportunities to flourish here in this community. Now I can't corroborate on this. I frankly do not know if this is the data that will be used in this long awaited for USGS report or not... really I don't. And I'm not here to say that it is. But it is a report offered by the USGS and it was prepared in cooperation with the Arizona Department of Water Resources (ADWR).
All I know is that the report was done by these government agencies and that they were nice enough to include an .xls link to a spread sheet with the data they reported on. It is this data that I will focus on in this post.
So are you ready?? (Dang, you could have read the whole USGS report by now instead of reading the lead up to the data findings that I'm about to share)
As I mentioned earlier, this USGS report has data on 208 existing wells, all within the three aquifers in Mohave County. The average water level change for all 208 wells shows an average loss of 1.75 feet from the time the water level of each well was originally read through to sometime in the year 2006.
Oh... you just know I'm not going to stop there. Much more breaking down of the data to do. But I'm starting with the overall figures for all of the 208 wells in the report.
Did you know of the 208 wells that 113 of them have actually had an increase in water level?? That is right, more than half of the wells studied have increased in water levels since they were first read and records kept. Before we start to party, 90 wells have decreased in water level. The remaining 5 recorded no change.
The figures for the 5 wells that saw the biggest drop in water level from the beginning of records through to 2006 were as follows; 134.8 feet, 69.9 feet, 66.7 feet, 55.7 feet, 52.7 feet. Now the figures for the 5 wells that saw the biggest increase in water level were as follows; 107.8 feet, 48.8 feet, 47.8 feet, 43.7 feet, 41.1 feet. The median figure for all 208 wells showed an increase of .4 feet.
As I moved along with my handy dandy data and spreadsheet, I saw the need to break out information from each aquifer... and I will do that below. But keep in mind something else and that is the element of time. You see not all of these water levels were originally recorded in the same year. Recording first started on 28 wells in 1963 through 1965 (according to the data). In 1978 through 1980 another 64 wells had their water levels first recorded. Then in 1995 and 1996 the government found the time to record the water levels in 116 additional wells (if you are checking my math at home, 28 + 64 + 116 = 208, right??). So yeah, of course I needed to break out the data further... and I will... but the following data is an overall look at the wells in each of the three aquifers according to the USGS report.
In the Hualapai Valley aquifer there are 100 wells. Measured in feet, the average net water level change shows a negative 5.41 feet per well.
There are 17 wells in the Detrital Valley aquifer and the average net water level changes shows a negative 4.22 feet per well.
Again folks, I'm doing averages here.
Now in the Sacramento Valley aquifer there are 91 wells and I found that the net water level change actually showed an increase of 2.73 feet per well. Yep, that is right, an increase in the average water level. How about that?? In a desert no less. A desert in a drought.
Math check... 100 + 17 + 91 = 208 right??
I could stop right here but the element of time had me intrigued to see what the averages might show over the varying lengths of time. The net water level changes (NWLC) for the wells originally recorded around 1964 (42 years) show an average loss in each well of 1.6 feet. The NWLC for the wells originally recorded around 1980 (26 years) show an average loss in each well of 0.8 feet. The NWLC for the wells originally recorded around 1996 (10 years) show an average loss in each well of 2.3 feet.
Now for the fun stuff, I'll be breaking the data down by year and by aquifer... this will be fun I promise.
I'll start with the Detrital Valley aquifer. It has the least amount of wells and there were only two time frames where original recording of water levels were done (three in each of the other aquifers).
There was one well that had an original recording from the 1964 era. That well has since increase its NWLC by 6.2 feet... an average annual increase of 0.148 feet a year. (Doing the math at home?? I divided the 6.2 figure by 42 years and I will use 42 years for all the of the 1964 era original water level recordings from here on out... 26 for the 1980 era water level recordings... and 10 for the 1996 era water level recordings). The other 16 wells showed an average drop in NWLC of 4.875 feet per well... an average decrease of 0.488 feet per well per year.
Still following?? Still two more aquifers to go.
Now we'll tackle the Sacramento Valley aquifer. There are 16 wells in that aquifer that recorded the original water level from the 1964 era. The average NWLC shows a decrease of 0.9 feet per well... an average decrease of 0.02 feet per year. There are 30 wells in this aquifer that first recorded water level in the 1980 era. The average NWLC for these wells shows an increase of 6.9 feet per well... an average increase of 0.265 feet per year. There are 45 wells in the aquifer that recorded water level in the 1995 era. The average NWLC for these wells shows an increase of 1.232 feet per well... an average increase of .123 feet per year.
One more to go... at a later time I may put together a table for easier viewing but don't have the time for that right now.
Last up is the Hualapai Valley aquifer. There are 11 wells in this aquifer that first recorded water level in the 1964 era. The average NWLC shows a decrease of 3.5 feet per well... an average decrease of 0.082 feet per year. There are 34 wells in the aquifer that first recorded water level in the 1980 era. The average NWLC shows a decrease of 7.6 feet per well... an average decrease of 0.294 per year. There are 55 wells in the aquifer that first recorded water level in the 1996 era. The average NWLC shows a decrease of 4.435 feet per well... an average decrease of 0.443 per year.
And there you go. Just the data and nothing but the data. Like I said earlier, I may put together a table that makes it easier to read the data that I broke out. Just don't have the time at the moment.
Draw you own conclusions and share them in the comments. Would love to see some input from the water worry warts as well. What does this data mean?? Your turn.
Post updated for data tables...
Data tables for applicable data used in this blog post.
| Era | 1964 | 1980 | 1996 |
|---|---|---|---|
| Total Number of Wells | 28 | 64 | 116 |
| NWLC | -1.6 | -0.8 | -2.297 |
| NWLC average per year | -0.039 | -0.032 | -0.230 |
| Aquifer Location | Hualapai Valley | Sacramento Valley | Detrital Valley |
|---|---|---|---|
| Total Number of Wells | 100 | 91 | 17 |
| NWLC | -5.41 | +2.73 | -4.22 |
| Aquifer Location | Hualapai Valley | Sacramento Valley | Detrital Valley |
|---|---|---|---|
| 1964 Era Wells | 11 | 16 | 1 |
| NWLC | -3.5 | -0.9 | +6.2 |
| NWLC average per year | -0.082 | -0.020 | +0.148 |
| 1980 Era Wells | 34 | 30 | N/A |
| NWLC | -7.6 | +6.9 | N/A |
| NWLC average per year | -0.294 | +0.265 | N/A |
| 1996 Era Wells | 55 | 45 | 16 |
| NWLC | -4.435 | +1.232 | -4.875 |
| NWLC average per year | -0.443 | +0.123 | -0.487 |
Subscribe to:
Posts (Atom)